

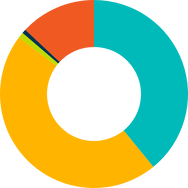
Gender
46% Male
39% Female
1% Non Binary
1% Prefer not to say
13% Not Stated
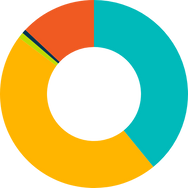
Gender Identity
76% Cisgender
2% Transgender
2% Prefer not to say
20% Not Stated
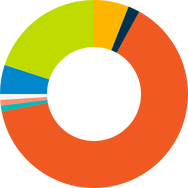
Sexuality
6% Bisexual
2% Gay
64% Heterosexual
1% Lesbian
1% Pansexual
1% Unsure
5% Did not disclose
20% Not stated
0% Other
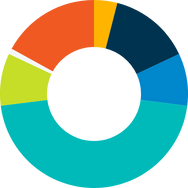
Ethnicity
4% Asian
14% Black
9% Mixed
46% White
9% Other
1% Did not disclose
17% Not stated
Religion
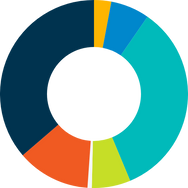
1% Agnostic
8% Christian
2% Atheist
17% Muslim
47% No religion
4% Did not disclose
20% Not stated
Disability
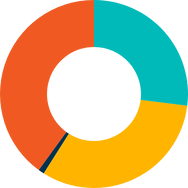
27% Disabled
32% Not disabled
1% Did not disclose
40% Not stated
Of those who have identified as disabled, these were split into the following categories:
17% Mental health
1% Visual impairment
6% Learning difficulties
1% Communication
4% Physical or mobility
0% Hearing impairment
1% Long-standing illness or condition
5% Neurological
1% Other





 English
  French
  Arabic
  Polish
  Chinese
  Urdu
Urdu  Pashto
  Kurdish